Project Description
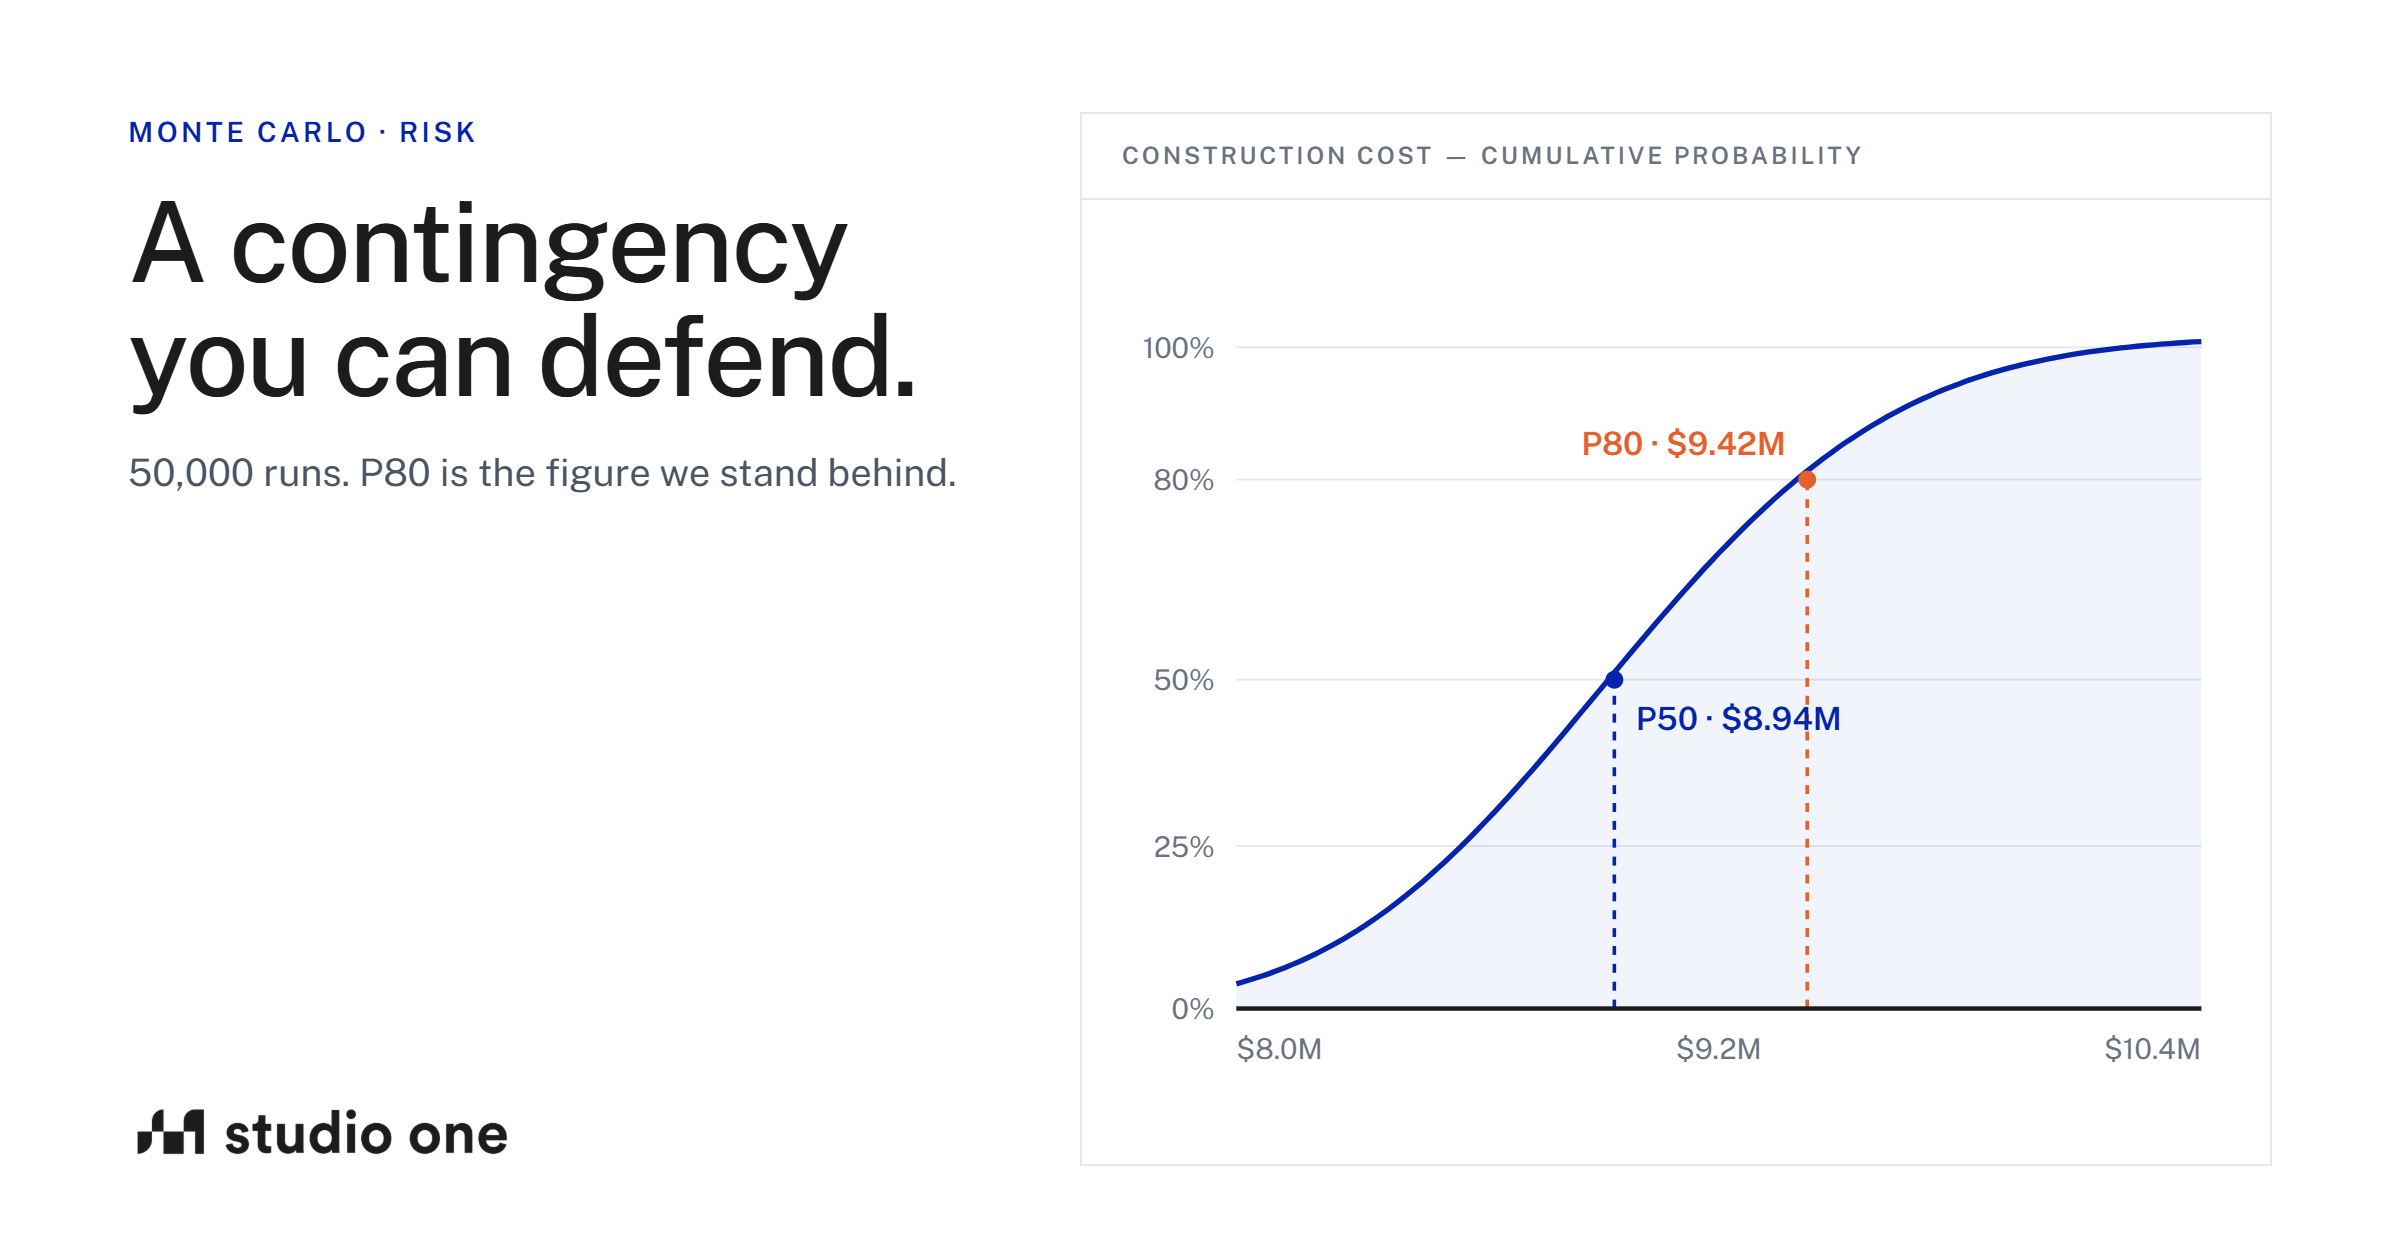
The starting point is a three-point estimate rather than a single figure for every cost element and every programme stage: low, most likely, high. At concept stage, before anything is firmed up, these ranges can be built from standard accuracy bands appropriate to the design stage rather than guessed line by line. The simulation then runs the project thousands of times (50,000 is a reasonable number), sampling a value from each range on every run rather than defaulting to the midpoint. The output isn't one number, it's a distribution: the full spread of plausible outcomes, and how probability is weighted across that spread. A few choices in how the model is built matter more than they're usually given credit for, and getting them wrong is easy to do without noticing. Distribution shape is the first one. A triangular distribution treats outcomes near the edges of the range as roughly as likely as outcomes near the middle. That's not how construction risk actually behaves: most risks cluster fairly tightly around the likely case, with genuine tails either side rather than a flat spread. PERT (Beta) distributions reflect that shape more accurately, and using triangular where PERT is the better fit overstates how wide the range really is. Correlation between risks is the one that gets missed most often, usually because independent sampling is the default assumption and nobody questions it. Ground conditions and foundation redesign aren't unrelated events on a project. A design review comment and a downstream consenting delay aren't unrelated either. Where risks are genuinely connected, they should be grouped so that when one fires in a given simulation run, the linked ones fire with it. Model them as independent instead, and the tail end of the distribution (the P90, P95 range) comes out looking a lot safer than it actually is. That's the single biggest way a Monte Carlo model can end up giving false confidence while still looking rigorous on the surface.
Programme risk and cost risk aren't separate either. A schedule blowout carries a real time-related cost with it (extended preliminaries, time-related overheads), so a properly built model feeds schedule outcomes back into the cost side rather than running the two as disconnected exercises sitting next to each other. Once the simulation has run, the output distribution on its own is only half the value. The more useful question is what's actually driving it, and that's where sensitivity analysis comes in: a correlation between each risk driver and the final outcome, ranked. That turns a register of forty-odd risks into a shortlist of the handful genuinely moving the number, which is far more useful to a design team than the full list. There's also a question of which percentile to actually use as the number you stand behind. P50 means the outcome is as likely to land over as under, which is reasonable for internal planning but not something to put in front of a client as a committed figure. P80 is the more defensible position, and it holds up better once correlated risks are modelled as correlated rather than independent, since risks landing together happens more often in reality than independent modelling suggests. The lesson worth passing on is that it's easy to build a Monte Carlo model that looks sophisticated and isn't. A model with independent risk treatment, triangular distributions, no sensitivity ranking, and a single random seed will produce a chart that looks convincing to most people in the room. It won't survive scrutiny from anyone who actually understands the method, and worse, it'll produce a number that's quietly wrong in the direction of overconfidence, which is exactly the failure mode the whole exercise is meant to prevent. Getting the correlation structure and distribution shapes right is where the real rigour sits, not in running more iterations or producing a nicer-looking output. The other thing worth flagging for anyone extending this to a portfolio of projects rather than one at a time: simply summing P80s across projects overstates true portfolio-level risk. Correlated exposure within a single project isn't the same thing as correlated exposure across a portfolio, and treating them the same way is a shortcut that undoes a lot of the rigour built into the individual project models.